Overview
The Linked Chart & Table Component is an innovative React tool designed to enhance data visualization by synchronizing charts and data tables effortlessly. Built using shadcn charts and Recharts, this component brings interactive features to your project, making it easier to manage and present data in a visually appealing way. Whether you’re working with complex datasets or simple tables, this component offers a smooth experience for both developers and users alike.
It’s particularly suitable for those who need to analyze data over different time frames, as well as for teams looking to customize their chart displays. The flexibility of using the component with or without a DataTable further enhances its utility, enabling a wide range of applications and use cases.
Features
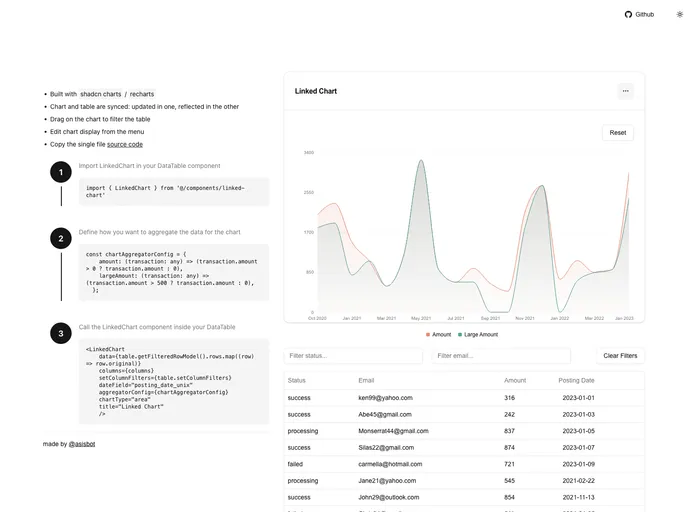
- Synchronized chart and table views: View chart data and table data simultaneously, ensuring both are always in sync for better analysis.
- Interactive chart selection filters table data: Click on chart elements to instantly filter and update table data, providing a dynamic user experience.
- Multiple date format options: Customize your time period display with options for month, quarter, year, and more to best suit your reporting needs.
- Configurable chart types: Choose from various chart types, including Area and Bar charts, allowing for tailored visual representations of your data.
- Standalone use capability: Utilize the LinkedChart component independently of the DataTable for scenarios where only a chart is necessary, enhancing its versatility.
- Easy integration: Seamlessly add the LinkedChart to your existing codebase, making it an accessible tool for developers looking to enrich their applications.
- Open-source project: Released under the MIT license, allowing for easy adaptation and modification to fit specific project requirements.


